

Image Details
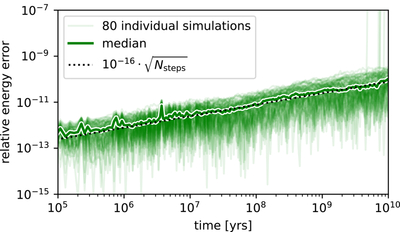
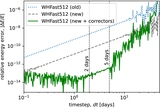
Caption: Figure 5.
The relative energy error as a function of time in 80 simulations of the solar system. The bold green line shows the median. The dotted line shows the expected behavior for an unbiased integrator that is accurate to machine precision after one time step. Several simulations go unstable at late times, leading to a large energy error.
Other Images in This Article
Copyright and Terms & Conditions
© 2026. The Author(s). Published by the American Astronomical Society.

Copyright ©
2026 Astronomy Image Explorer. All Rights Reserved.
