

Image Details
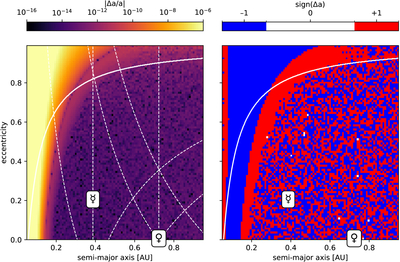
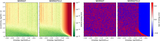
Caption: Figure 3.
The same as the first two panels of Figure 2, but each particle is integrated for 1000 orbital periods. The top and left of the plots show a biased error growth. The bottom right of the plots show an unbiased error growth in the most important area of parameter space.
Other Images in This Article
Copyright and Terms & Conditions
© 2026. The Author(s). Published by the American Astronomical Society.

Copyright ©
2026 Astronomy Image Explorer. All Rights Reserved.
