

Image Details
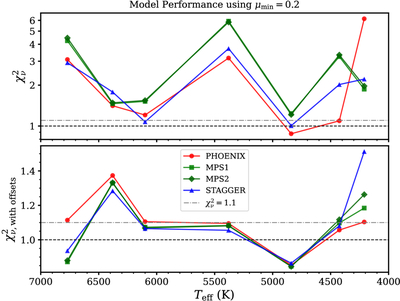
Caption: Figure 12.
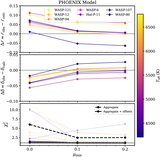
Model performance comparison as a function of stellar effective temperature, using ﹩{\mu }_{{\rm{\min }}}=0.2﹩. Top: ﹩{\chi }_{\nu }^{2}﹩ without offsets applied, showing the raw model performance. Bottom: ﹩{\chi }_{\nu }^{2}﹩ with gray offsets applied, demonstrating that all models can achieve acceptable fits (﹩{\chi }_{\nu }^{2}\lesssim 1.1﹩, dotted–dashed lines) when offsets are included. Note that the top panel has a different y-range and is plotted on a log scale compared to the bottom panel, which is on a linear scale.
Other Images in This Article
Show More
Copyright and Terms & Conditions
© 2026. The Author(s). Published by the American Astronomical Society.

Copyright ©
2026 Astronomy Image Explorer. All Rights Reserved.
