

Image Details
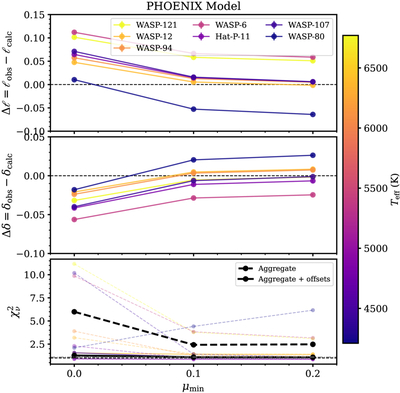
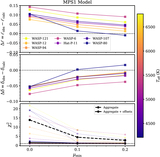
Caption: Figure 9.
PHOENIX model limb-darkening comparison as a function of ﹩{\mu }_{{\rm{\min }}}﹩. Top: offset in the linear coefficient, Δℓ, for each target. Middle: offset in the curvature coefficient, Δδ. Bottom: reduced chi-square (﹩{\chi }_{\nu }^{2}﹩) for each target (colored lines) and the aggregate statistics summing across all systems (black), shown both with and without offsets applied. Points are colored by stellar effective temperature.
Other Images in This Article
Show More
Copyright and Terms & Conditions
© 2026. The Author(s). Published by the American Astronomical Society.

Copyright ©
2026 Astronomy Image Explorer. All Rights Reserved.
