

Image Details
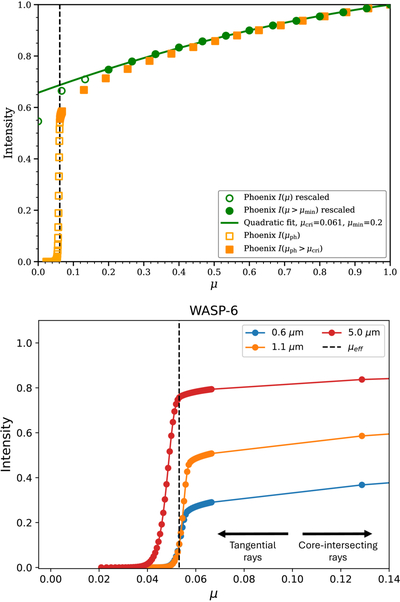
Caption: Figure 4.
Spherical PHOENIX intensity profiles for WASP-6 (Teff = 5400 K, ﹩{\mathrm{log}}\,g=4.5﹩). Top: illustration of the maximum-derivative μ-rescaling procedure. The stellar limb is redefined at μcri (determined from the maximum dI/dμ derivative), and the remaining intensities (solid) are rescaled and interpolated onto a uniform μ grid. An optional ﹩{\mu }_{{\rm{\min }}}﹩ cutoff can be applied when fitting limb-darkening laws to avoid residual edge effects. Bottom: illustration of the τ = 1- μ-rescaling method. Intensity profiles at optical, near-IR, and mid-IR wavelengths showing the transition between the densely sampled tangential rays (low μ) and core-intersecting rays (high μ). The vertical dotted lines indicate μeff, calculated from the τslant = 1 surface as described in Section 3.1.
Other Images in This Article
Show More
Copyright and Terms & Conditions
© 2026. The Author(s). Published by the American Astronomical Society.

