

Image Details
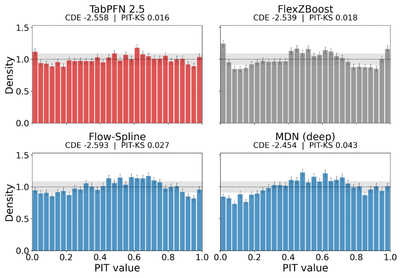
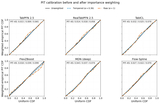
Caption: Figure 1.
PIT histograms for TabPFN 2.5, FlexZBoost, Flow-Spline, and MDN-deep. Panels are ordered by PIT-KS. The dotted line at density 1 marks the target uniform (0, 1) density; the gray band is the 95% pointwise binomial envelope expected under exact uniformity at this test-set size, and per-bin error bars are ±1 SE. TabPFN 2.5 shows the smallest aggregate PIT-KS among these methods and no large structured departure from uniformity. FlexZBoost has a comparable PIT-KS but shows excess mass near the boundaries, indicating overconfident tails. MDN-deep and Flow-Spline show milder central excesses, consistent with slight underconfidence.
Other Images in This Article
Copyright and Terms & Conditions
© 2026. The Author(s). Published by the American Astronomical Society.

