

Image Details
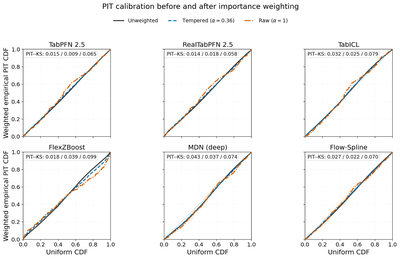
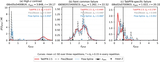
Caption: Figure C1.
PIT P–P curves at ntrain = 121,626 before and after importance weighting. The black, blue, and orange curves correspond to the unweighted, tempered (α ≃ 0.36), and raw (α = 1) evaluations, respectively. The dotted diagonal represents exact PIT uniformity, and the PIT-KS values in each panel follow the legend order. This comparison diagnoses sensitivity to reweighting over the observed covariates.
Other Images in This Article
Copyright and Terms & Conditions
© 2026. The Author(s). Published by the American Astronomical Society.

Copyright ©
2026 Astronomy Image Explorer. All Rights Reserved.
