

Image Details
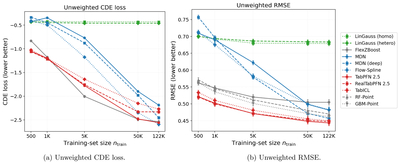
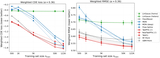
Caption: Figure 5.
Performance versus training-set size under the unweighted spectroscopic-test distribution. Each curve shows the mean over five repetitions, and error bars indicate ±1 SE. Methods are color coded by family (linear, tree-based, neural, foundation). Foundation models (red) lead the RMSE curve at every ntrain, while on the unweighted CDE loss they are matched at the largest sample size by the density-optimized baselines (Flow-Spline, FlexZBoost).
Other Images in This Article
Copyright and Terms & Conditions
© 2026. The Author(s). Published by the American Astronomical Society.

Copyright ©
2026 Astronomy Image Explorer. All Rights Reserved.
