

Image Details
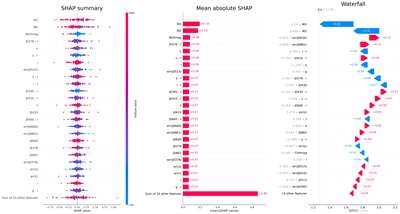
Caption: Figure 7.
An SHAP interpretation for TabPFN 2.5. Left: beeswarm summary over 100 explained test objects. Features are ordered by mean absolute SHAP value; each point is one object, the horizontal position gives the contribution to the predicted redshift, and color encodes the feature value from low (blue) to high (red). Middle: global feature-importance bar plot, where each bar is the mean absolute SHAP value over the explained objects. The two global panels show the 25 highest-ranked named features, with the remaining 14 features grouped in the final aggregate row. Right: waterfall explanation for one prediction (test_index = 102), showing how the model moves from E[f(X)] = 1.69 to f(x) = 1.279, compared with zspec = 1.423.
Other Images in This Article
Copyright and Terms & Conditions
© 2026. The Author(s). Published by the American Astronomical Society.

