

Image Details
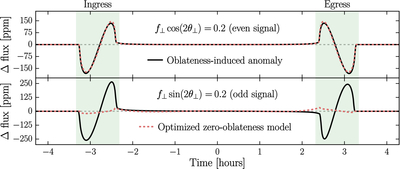
Caption: Figure 1.
The even-symmetry component of the oblateness signal (top panel) is much harder to detect than the odd-symmetry signal (bottom panel). The black curves show the deviations between an oblate-planet model and the spherical-planet model for TOI-199 b, obtained by setting f⊥ = 0 without optimizing the other transit parameters (f⊥ and θ⊥ are defined in Section 4). Green regions are ingress and egress, where the deviations are largest. Dashed red curves show the deviations after optimizing the parameters of the spherical-planet model. Although the even component can be mimicked almost exactly, the odd component still stands out.
Other Images in This Article
Copyright and Terms & Conditions
© 2026. The Author(s). Published by the American Astronomical Society.

