

Image Details
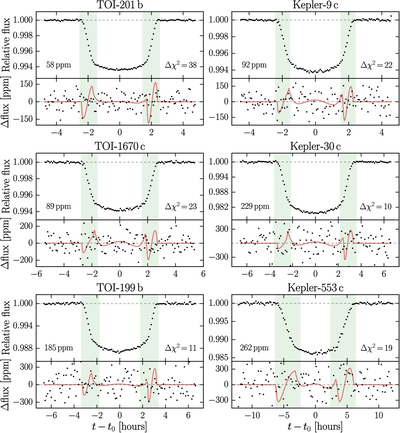
Caption: Figure 2.
Stacked and binned transit light curves for our six targets. In the panel beneath each light curve, black points are deviations between the data and the best-fit spherical-planet model, and red curves are deviations between a fiducial oblate-planet model with f⊥ = 0.2 and θ⊥ = 45∘, and other parameters optimized, and the best-fit spherical-planet model. The red curves illustrate the variety of anomalies that can result from oblateness. To the left of each light curve is the residual scatter in ppm, and to the right is the Δχ2 by which the best-fit spherical-planet model is preferred over the fiducial oblate-planet model.
Other Images in This Article
Copyright and Terms & Conditions
© 2026. The Author(s). Published by the American Astronomical Society.

