

Image Details
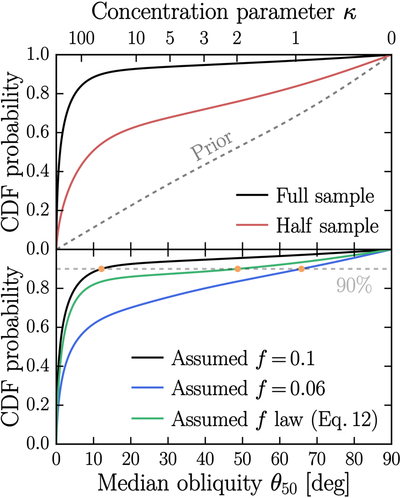
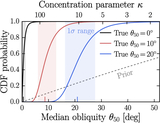
Caption: Figure 4.
CDF of the median obliquity, θ50, from our hierarchical Bayesian analysis. The upper horizontal axis translates θ50 into the concentration κ of the Fisher distribution. Black curves are posteriors based on the full sample, assuming all planets have f = 0.1, comparable to Saturn. The blue curve is the posterior assuming f = 0.06, comparable to Jupiter. The red curve is based on half the planets; weaker constraints are obtained, reflecting the fact that useful information is distributed across all systems. The green curve shows the posterior assuming f is assigned via Equation (12). Assuming f = 0.1 or f = 0.06, the data imply θ50 < 12∘ or θ50 < 66∘, respectively, at 90% confidence.
Other Images in This Article
Copyright and Terms & Conditions
© 2026. The Author(s). Published by the American Astronomical Society.

