

Image Details
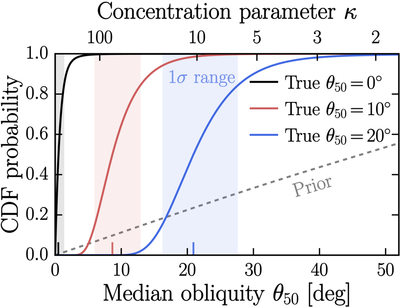
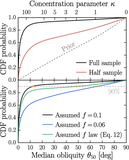
Caption: Figure 5.
Forecast for the constraints on the obliquity distribution provided by a sample of six objects with JWST-quality oblateness constraints (see Section 6.3). The three curves are CDFs for the median obliquity based on six simulated datasets created using Fisher distributions with different θ50 values, and assuming f = 0.1. One-sigma ranges are shown as shaded regions, and median values are indicated on the horizontal axis. Six precise transit light curves of targets as observationally favorable as TOI-201 b would provide enough information to distinguish between θ50 ≈ 0∘, ≈10∘ and θ50 ≈ 20∘.
Other Images in This Article
Copyright and Terms & Conditions
© 2026. The Author(s). Published by the American Astronomical Society.

Copyright ©
2026 Astronomy Image Explorer. All Rights Reserved.
