

Image Details
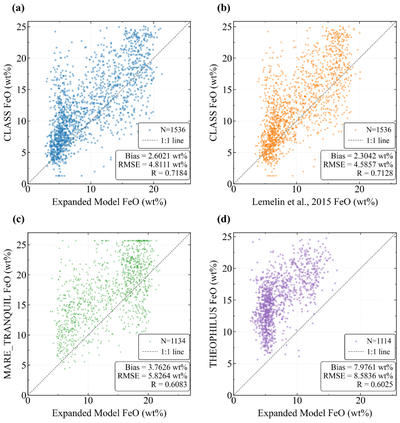
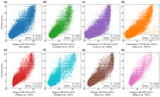
Caption: Figure 7.
Pixel-by-pixel comparison between optical FeO retrievals and Chandrayaan-2 CLASS Fe abundances. (a) Expanded model versus CLASS (global, N = 1536); (b) M. Lemelin et al. (2015) vs. CLASS (global, N = 1536); (c) Expanded model vs. CLASS in Mare Tranquillitatis (15 km × 15 km, N = 1134); (d) Expanded model vs. CLASS in the Theophilus highland crater (15 km × 15 km, N = 1114). Dashed lines denote the 1:1 relationship. Bias, RMSE, and Pearson correlation coefficient are reported in each panel.
Other Images in This Article
Copyright and Terms & Conditions
© 2026. The Author(s). Published by the American Astronomical Society.

Copyright ©
2026 Astronomy Image Explorer. All Rights Reserved.
