

Image Details
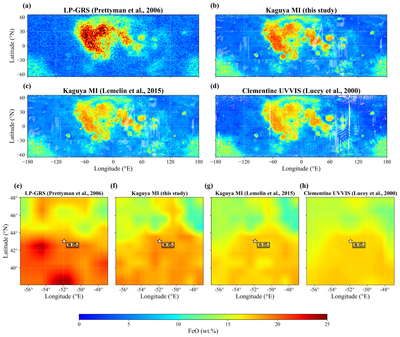
Caption: Figure 3.
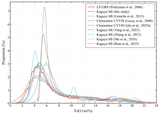
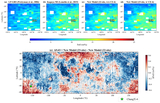
Global and regional FeO abundance maps. (a)–(d) Global FeO abundance maps (65∘S–65∘N): (a) LP-GRS (1∘ resolution; T. H. Prettyman et al. 2006); (b) Kaguya MI (this study; 59 m resolution); (c) Kaguya MI (59 m resolution; M. Lemelin et al. 2015); (d) Clementine UVVIS (200 m resolution; P. G. Lucey et al. 2000). (e)–(h) Local FeO retrieval behavior at the CE-5 landing site region, illustrating the sharpened high-FeO signal enabled by including CE-5 (and CE-3/CE-6) as calibration anchors: (e) LP-GRS (T. H. Prettyman et al. 2006); (f) Kaguya MI (this study); (g) Kaguya MI (M. Lemelin et al. 2015); (h) Clementine UVVIS (P. G. Lucey et al. 2000).
Other Images in This Article
Copyright and Terms & Conditions
© 2026. The Author(s). Published by the American Astronomical Society.

