

Image Details
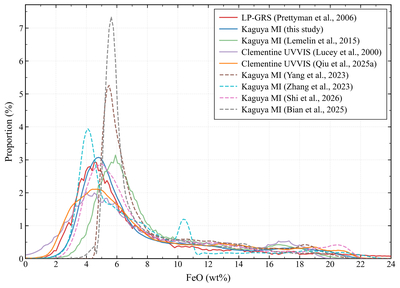
Caption: Figure 5.
Frequency distributions of FeO abundance from the expanded model, LP-GRS, and the previously published retrieval frameworks discussed in Section 3.1—including the angular-parameter methods of P. G. Lucey et al. (2000), M. Lemelin et al. (2015), and D. Qiu et al. (2025a), and the machine learning-based products of C. Yang et al. (2023), L. Zhang et al. (2023), X. Shi et al. (2026), and C. Bian et al. (2025), resampled to 1∘ × 1∘ and clipped to 65∘S–65∘N for consistency with the other products. Distributions are shown as line curves, binned at equal 0.139 wt% FeO intervals; a small number of outlier bins, arising from sparse pixel counts near the edges of individual products’ valid data range, were excluded for visual clarity. Quantitative mean/mode statistics (Table 3) are reported only for the four primary optical retrieval frameworks; modal offsets for the machine learning-based products are not separately tabulated.
Other Images in This Article
Copyright and Terms & Conditions
© 2026. The Author(s). Published by the American Astronomical Society.

