

Image Details
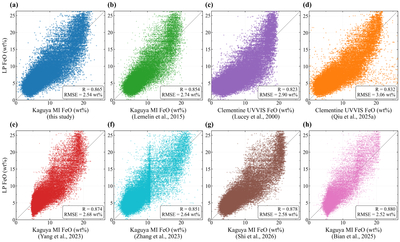
Caption: Figure 4.
Pixel-to-pixel comparison of retrieved FeO abundance vs. LP-GRS at 1∘ resolution, restricted to the common valid-pixel subset shared by all eight compared methods (n = 43,721, 93.4% of the full 65∘S–65∘N grid; dashed line = 1:1). (a) Kaguya MI (this study); (b) Kaguya MI (M. Lemelin et al. 2015); (c) Clementine UVVIS (P. G. Lucey et al. 2000); (d) Clementine UVVIS (D. Qiu et al. 2025a); (e) Kaguya MI (C. Yang et al. 2023); (f) Kaguya MI (L. Zhang et al. 2023); (g) Kaguya MI (X. Shi et al. 2026); (h) Kaguya MI (C. Bian et al. 2025).
Other Images in This Article
Copyright and Terms & Conditions
© 2026. The Author(s). Published by the American Astronomical Society.

Copyright ©
2026 Astronomy Image Explorer. All Rights Reserved.
