

Image Details
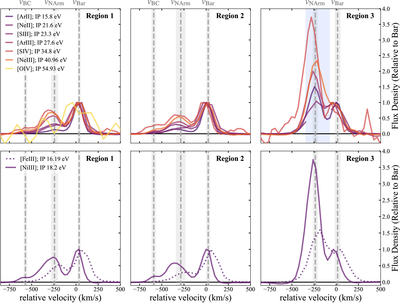
Caption: Figure 4.
Continuum-subtracted, defringed spectra with peak S/N ≳ 10 extracted from Regions 1–3 (Figure 1). Lines are fit by up to three Gaussians with different Doppler-shifted vrad (dashed gray lines), corresponding to the Bar (vBar ∼ 0 km s−1), Northern Arm (vNArm ∼ −270 km s−1), and BC structures (vBC ∼ −570 km s−1). All lines are colored by IP and expressed in relative flux density units, normalized to the Bar’s peak flux. Top: α elements. Bottom: [Fe III] 22.93 μm and [Ni III] 7.352 μm. See Appendix B.1 for further discussion of rest wavelength uncertainties for these lines. Dashed gray lines indicate each fit component’s vrad averaged across lines and 1σ standard deviation. The saturated portion of Region 3’s [Ne II] 12.81 μm line is marked with a blue shaded box. The Northern Arm and BC structures have relatively stronger higher-IP lines than lower-IP lines when compared to the Bar. They also show strongly enhanced nickel flux relative to iron when compared to the Bar.
Other Images in This Article
Show More
Copyright and Terms & Conditions
© 2026. The Author(s). Published by the American Astronomical Society.

