

Image Details
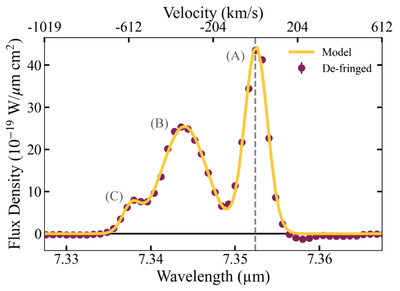
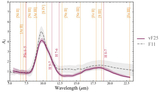
Caption: Figure 3.
An example defringed and continuum-subtracted spectral line ([Ni III] 7.35 μm) extracted from Region 2 (Figure 1). Defringed data (maroon) are overlaid with the best-fit multi-Gaussian model (yellow line) with fit components labeled A–C, and the black line represents the continuum model.
Other Images in This Article
Show More
Copyright and Terms & Conditions
© 2026. The Author(s). Published by the American Astronomical Society.

Copyright ©
2026 Astronomy Image Explorer. All Rights Reserved.
