

Image Details
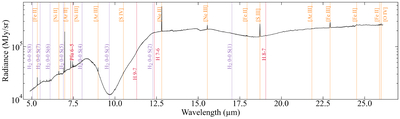
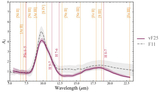
Caption: Figure 2.
Summed 4.9–27.9 μm MIRI/MRS observed spectrum extracted from the ∼3″ × 3″ Ch1 footprint, with identified fine-structure (orange), recombination (dark red), and H2 shock emission lines (purple) are labeled.
Other Images in This Article
Show More
Copyright and Terms & Conditions
© 2026. The Author(s). Published by the American Astronomical Society.

Copyright ©
2026 Astronomy Image Explorer. All Rights Reserved.
