

Image Details
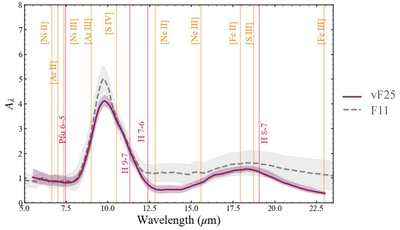
Caption: Figure D1.
Comparison of the vF25 (solid purple line) and F11 (gray dashed line) extinction models. Shading around each line indicates the 1σ confidence intervals. Vertical lines show the relevant hydrogen recombination (red) and ionic lines (orange) used for calculating abundances.
Other Images in This Article
Show More
Copyright and Terms & Conditions
© 2026. The Author(s). Published by the American Astronomical Society.

Copyright ©
2026 Astronomy Image Explorer. All Rights Reserved.
