

Image Details
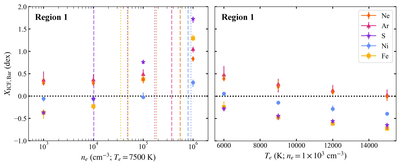
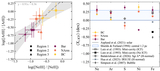
Caption: Figure D3.
Dependence of the derived Region 1 Bar abundances (XICF,Bar; log form and solar normalized) on assumed ne and Te. The left panel shows the effect of varying ne = [103, 106] cm−3 at fixed Te = 7500 K, and the right panel shows varying Te = [6000, 15,000] K at fixed ne = 103 cm−3. Vertical dashed (dotted) lines in the left panel mark ncrit for the lower (higher) IP ions used to calculate Xi,Bar (Table 1). The horizontal dotted line marks solar abundance. Uncertainties are estimated via MC propagation of line flux uncertainties through PyNeb. XICF,Bar increases with ne and decreases with Te, and elements with low ncrit are the most sensitive to the chosen ne.
Other Images in This Article
Show More
Copyright and Terms & Conditions
© 2026. The Author(s). Published by the American Astronomical Society.

