

Image Details
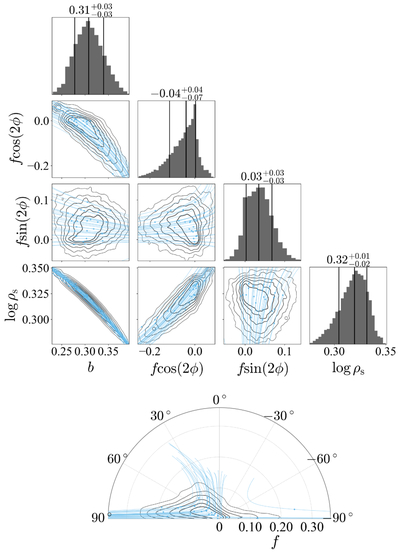
Caption: Figure 7.
Comparison between the posterior distribution obtained by Q. Liu et al. (2024) for an elliptical transit model of Kepler-51d and the shape–orbit degeneracy predicted by the Radon transform approximation. The top panels show the posterior in b, ﹩f\cos (2\phi )﹩, ﹩f\sin (2\phi )﹩, and ﹩{{\mathrm{log}}}_{10}[{\rho }_{s}/({\rm{g}}\,{\mathrm{cm}}^{-3})]﹩. Here f and ϕ denote the projected oblateness and position angle, respectively. These correspond to f⊥ and θ⊥ in Q. Liu et al. (2024). The light-blue points indicate selected posterior samples, and the light-blue curves show the analytic degeneracy curves passing through them. The bottom panel shows the same posterior and analytic curves in polar coordinates, with radius f and angle ϕ.
Other Images in This Article
Copyright and Terms & Conditions
© 2026. The Author(s). Published by the American Astronomical Society.

