

Image Details
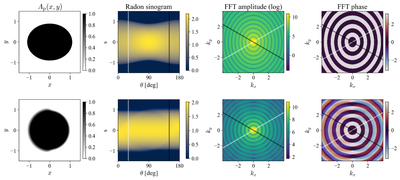
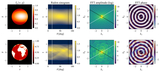
Caption: Figure 4.
Radon projections and Fourier domain representations of two synthetic spatial patterns of Ap(x, y). Each row shows, from left to right, the spatial map, its Radon sinogram, the log-scaled Fourier amplitude, and the Fourier phase. The white and black lines indicate the information accessible from a transit with θi = 30∘ and θe = 150∘, corresponding to an impact parameter of b ∼ 0.5. All other regions in the Radon domain and in the Fourier domain are inaccessible in the Radon transform limit.
Other Images in This Article
Copyright and Terms & Conditions
© 2026. The Author(s). Published by the American Astronomical Society.

Copyright ©
2026 Astronomy Image Explorer. All Rights Reserved.
