

Image Details
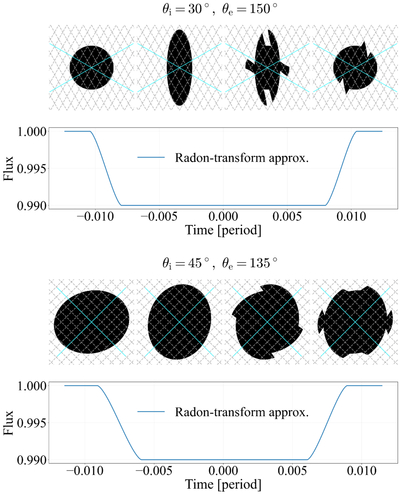
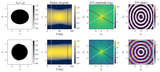
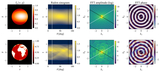
Caption: Figure 5.
Examples of nonuniqueness for opaque silhouettes in the Radon transform limit. The four panels in the top row show silhouettes that produce the same light curve for (θi, θe) = (30∘, 150∘): a circular silhouette, an elliptical silhouette, and two more complicated shapes. The four panels in the third row show silhouettes that produce the same light curve for (θi, θe) = (45∘, 135∘): two elliptical silhouettes with different projected position angles and two more complicated shapes. The blue lines indicate the local normals to the stellar limb at ingress and egress, and the gray dashed lines show a grid parallel to the locally linearized limb. The corresponding light curves are shown beneath each group of silhouettes. In these calculations, the planet-to-star area ratio was set to 0.01, the orbital eccentricity to zero, the scaled semimajor axis to a/Rs = 15, and the mid-transit time to 0. The impact parameter was calculated to achieve the given (θi, θe).
Other Images in This Article
Copyright and Terms & Conditions
© 2026. The Author(s). Published by the American Astronomical Society.

