

Image Details
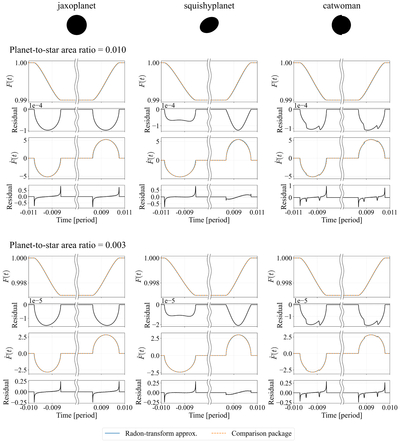
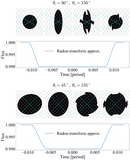
Caption: Figure 3.
Comparison of light curves from several transit model codes with those predicted by the Radon transform approximation. Only the portions of the light curves around ingress and egress are shown. We show cases with planet-to-star area ratios of 0.01 (top panels) and 0.003 (bottom panels). From left to right, the columns show results for a circular silhouette computed with jaxoplanet (S. Hattori et al. 2024), an elliptical silhouette computed with squishyplanet (B. Cassese et al. 2024), and a silhouette composed of two semicircles computed with catwoman (N. Espinoza & K. Jones 2021; K. Jones & N. Espinoza 2022), together with the corresponding Radon transform approximations. The planetary silhouettes used in each model are shown at the top of each column. For each planet-to-star area ratio, the upper two rows show the light curves and their residuals, defined as approximation minus model, while the lower two rows show the corresponding time derivatives and their residuals. In these calculations, the orbital eccentricity was set to zero, the scaled semimajor axis was set to a/Rs = 15, the impact parameter was set to 0.5, and the mid-transit time was set to 0. All model light curves were computed for a uniform stellar disk, without limb darkening.
Other Images in This Article
Copyright and Terms & Conditions
© 2026. The Author(s). Published by the American Astronomical Society.

