

Image Details
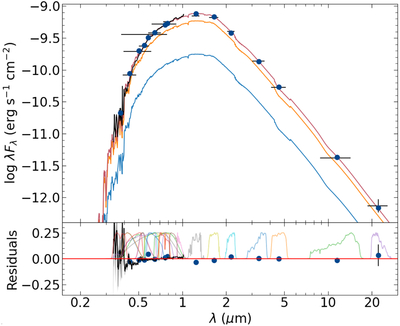
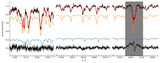
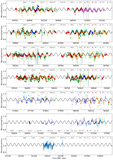
Caption: Figure 5.
SED fit: the red line represents the total flux of the system, while the orange and blue lines correspond to the two components. The fit residuals include schematic plots of the transmission curves for the filters used. The corrected GAIA XP spectrum is shown as a black line for comparison.
Other Images in This Article
Show More
Copyright and Terms & Conditions
© 2026. The Author(s). Published by the American Astronomical Society.

Copyright ©
2026 Astronomy Image Explorer. All Rights Reserved.
