

Image Details
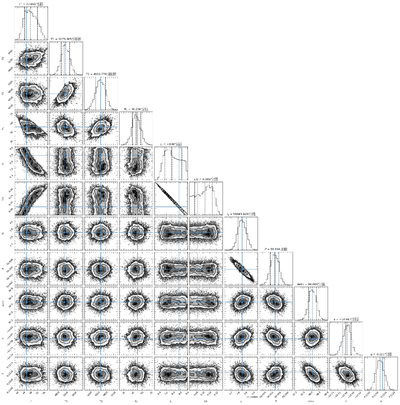
Caption: Figure 6.
Corner plot showing the posterior distribution from the PHOEBE solution. We present the parameters of the best-fitting model (indicated by blue lines) along with the median values and 16th and 84th percentiles (shown in the titles).
Other Images in This Article
Show More
Copyright and Terms & Conditions
© 2026. The Author(s). Published by the American Astronomical Society.

Copyright ©
2026 Astronomy Image Explorer. All Rights Reserved.
