

Image Details
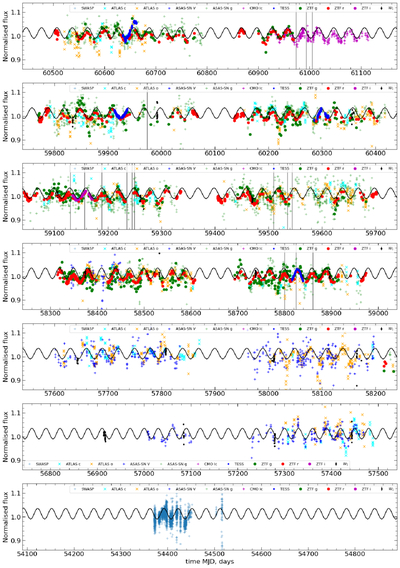
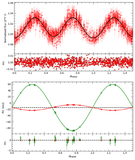
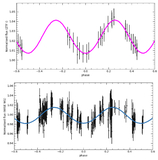
Caption: Figure 9.
All photometric observations plotted against time. A sine function computed with half the derived period and an amplitude of 0.02 is shown to guide the eye. The times of spectral observations are indicated as vertical lines.
Other Images in This Article
Show More
Copyright and Terms & Conditions
© 2026. The Author(s). Published by the American Astronomical Society.

Copyright ©
2026 Astronomy Image Explorer. All Rights Reserved.
