

Image Details
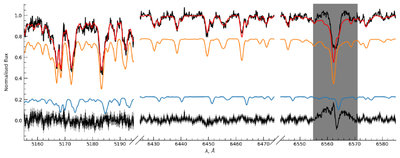
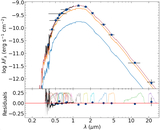
Caption: Figure 4.
Example of the spectral fit for an observation taken on MJD = 59156.7. The region around the Hα line was masked out during the fitting process (gray area). The black line shows the observed spectrum, the red line is the best-fit model, the orange and blue lines are two components of the binary. The black line surrounded by the gray shaded region is the fit residuals with spectrum error.
Other Images in This Article
Show More
Copyright and Terms & Conditions
© 2026. The Author(s). Published by the American Astronomical Society.

Copyright ©
2026 Astronomy Image Explorer. All Rights Reserved.
