

Image Details
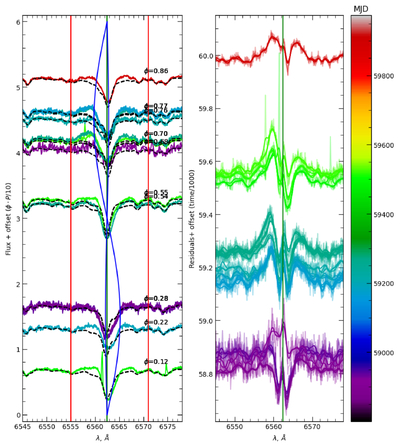
Caption: Figure 11.
Dynamical spectrum of the Hα line. The left panel shows the observed normalized fluxes and best-fitting models (dashed lines), shifted vertically according to the orbital phase. Note that the region ± 8 Å around Hα was excluded from the fit. The expected positions of Hα for both spectral components are shown as blue lines. The right panel shows the fit residuals and their smoothed versions (solid lines), shifted vertically according to the observational time. The color scheme is the same in both panels.
Other Images in This Article
Show More
Copyright and Terms & Conditions
© 2026. The Author(s). Published by the American Astronomical Society.

Copyright ©
2026 Astronomy Image Explorer. All Rights Reserved.
