

Image Details
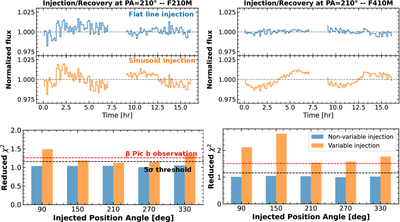
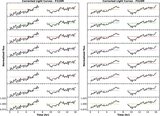
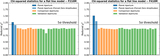
Caption: Figure 12.
Summary of the injection-and-recovery test results for the F210M (left) and F410M (right). The upper panels show recovered light curves when injecting a flat line (blue) and a sinusoid (orange). The most noisy recovered light curves are presented to show the pessimistic scenario. The lower panels show the reduced χ2 between the recovered light curves and a flat line. The 5σ threshold and the observed values for β Pic b are shown as black and red horizontal lines, respectively, for comparison.
Other Images in This Article
Show More
Copyright and Terms & Conditions
© 2026. The Author(s). Published by the American Astronomical Society.

Copyright ©
2026 Astronomy Image Explorer. All Rights Reserved.
