

Image Details
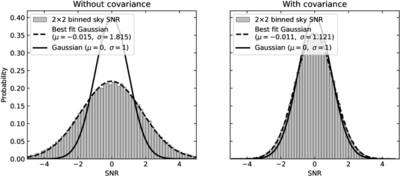
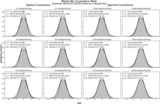
Caption: Figure 8.
Validation of covariance propagation, shown for the example target J0910b. Histograms of the signal-to-noise ratio (SNR) measured in blank-sky regions after coaddition, computed after rebinning the maps into 2 × 2 spaxel bins. Left: SNR computed using only the diagonal variances of the variance cube, ignoring covariance between neighboring spaxels. The resulting distribution is broader than the expected Gaussian distribution (μ = 0, σ = 1), indicating that the uncertainties are underestimated when correlations are neglected. Right: SNR computed using the full propagated covariance matrix. The distribution becomes consistent with this expectation, as expected for correctly estimated uncertainties. Similar behavior is observed for larger spatial binning schemes (e.g., 3 × 3 spaxels), confirming that the covariance-aware coaddition correctly captures correlated noise in the data.
Other Images in This Article
Copyright and Terms & Conditions
© 2026. The Author(s). Published by the American Astronomical Society.

