

Image Details
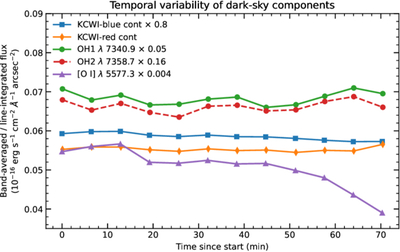
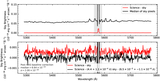
Caption: Figure 2.
Temporal variability of dark-sky components measured from the twelve dark exposures of the 2024 February 8 observing sequence shown in Figure 1, using individual KCWI-blue and KCWI-red exposures. The blue and red continua exhibit correlated variability at the ∼1%–2% rms level, indicating stable large-scale background conditions. The OH emission lines at λ7340.9 and λ7358.7 show coherent variability (∼2% rms; ∼8% peak to peak), consistent with common-mode fluctuations within the mesospheric OH emission layer. In contrast, the atomic [O I] λ5577 line exhibits a monotonic decline of ∼34% over the ∼70 minute sequence, evolving independently from the OH emission. This decoupled behavior reflects the distinct excitation mechanisms and atmospheric layers responsible for molecular and atomic airglow emission.
Other Images in This Article
Copyright and Terms & Conditions
© 2026. The Author(s). Published by the American Astronomical Society.

