

Image Details
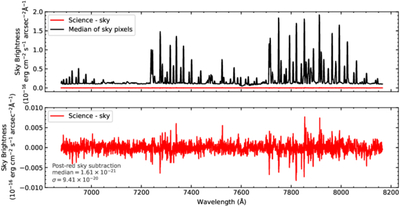
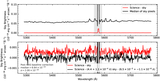
Caption: Figure 7.
Example of sky subtraction in KCWI-red observations, illustrating the performance of the iterative sky-subtraction and CR removal procedure described in Section 4.2. Adapted from Z. Lin et al. (2025) with updated residual statistics. Top: median sky spectrum measured from sky pixels (black) and the residual after iterative sky subtraction and CR removal (red). The sky background is dominated by strong OH emission lines, with a continuum level of ∼7 × 10⁻¹⁸ erg cm−2 s−1 arcsec−2 Å−1 over the wavelength range shown. Bottom: zoom-in of the residual spectrum. The residual background is statistically consistent with zero median (﹩{\tilde{S}}_{{\rm{res}}}\simeq 1.6\times 1{0}^{-21}﹩) and exhibits ﹩{\sigma }_{{\rm{res}}}\simeq 9.4\times 1{0}^{-20}﹩ erg cm−2 s−1 arcsec−2 Å−1.
Other Images in This Article
Copyright and Terms & Conditions
© 2026. The Author(s). Published by the American Astronomical Society.

