

Image Details
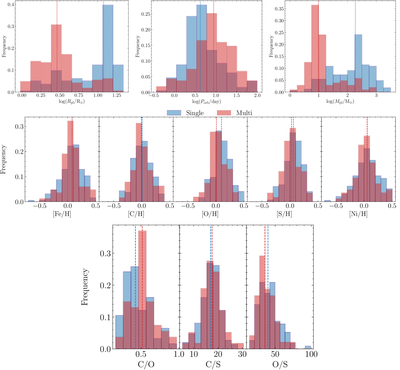
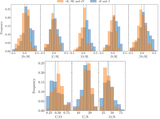
Caption: Figure 7.
Histograms of ﹩\mathrm{log}({R}_{{\rm{pl}}\,}/{\,{\rm{R}}}_{\oplus })﹩, ﹩\mathrm{log}({P}_{{\rm{orb}}\,}\,{{\rm{day}}}^{-1})﹩, ﹩\mathrm{log}({M}_{\,{\rm{pl}}\,}/{M}_{\oplus })﹩ (top panels), host star [X/H] (middle panels), and C/O, C/S, and O/S abundance ratios (bottom panels). Systems having only one confirmed exoplanet (singles) are shown in blue and systems with more than one confirmed exoplanet in red (multis). The dashed lines indicate the median values of each parameter, and the colors match the ones from the histogram bars. The median differences (singles minus multis) are 0.00, 0.01, 0.09, 0.03, 0.00, −0.09 ((ΔC/O)/(C/Osingles) ∼ 21%), −0.62 (∼4%) and 4.15 (∼10%) for [Fe/H], [C/H], [O/H], [S/H], [Ni/H], C/O, C/S, and O/S, respectively.
Other Images in This Article
Show More
Copyright and Terms & Conditions
© 2026. The Author(s). Published by the American Astronomical Society.

