

Image Details
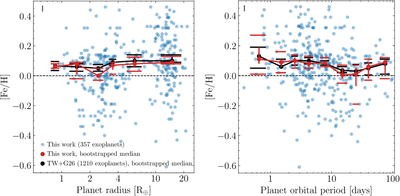
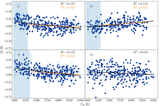
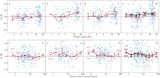
Caption: Figure 9.
Distribution of [Fe/H] of host stars with planet radius (left panel) and planet orbital period (right panel). The blue circles represent the sample from this work. The red circles represent the median abundances of the 1000 bootstrapped samples and their 68% confidence interval range of the distribution (equivalent to a 1σ range for a symmetric distribution) for the bins (0.7, 1], (1, 1.9], (1.9, 3], (3, 4], (4, 8], and (8, 22] R⊕ and (0.3, 1], (1, 2], (2, 3], (3, 5.5], (5.5, 10], (10, 20], (20, 30], (30, 50], and (50, 100] days. The red horizontal bars represent the 95% confidence interval range, equivalent to a 2σ range. The black circles and horizontal bars correspond to the same quantities derived from the combination of the sample from this work and from L. Ghezzi et al. 2026. The black dashed lines represent the solar values. In the top left of each panel, we show the median uncertainties in gray.
Other Images in This Article
Show More
Copyright and Terms & Conditions
© 2026. The Author(s). Published by the American Astronomical Society.

