

Image Details
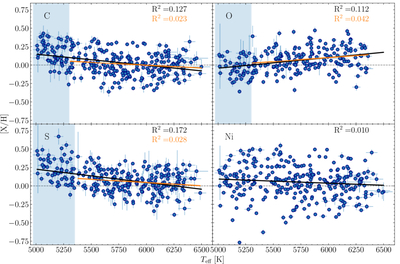
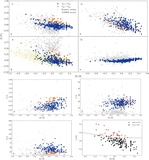
Caption: Figure 5.
Distribution of [X/H] with Teff. The black line represents the linear fit for the whole sample. The orange line represents the linear fit for the stars outside the blue region. In the upper right corner, we show the R2 statistics of each OLS regression. The gray dashed line represents [X/H] = 0.00 dex.
Other Images in This Article
Show More
Copyright and Terms & Conditions
© 2026. The Author(s). Published by the American Astronomical Society.

Copyright ©
2026 Astronomy Image Explorer. All Rights Reserved.
