

Image Details
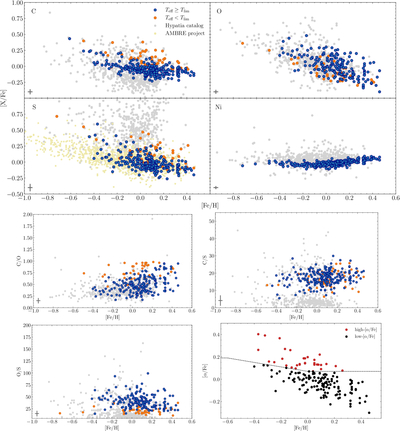
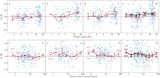
Caption: Figure 6.
Distribution of [X/Fe] of C (left panel of first row), O (right panel of first row), S (left panel of second row), Ni (right panel of second row), C/O (left panel of third row), C/S (right panel of third row), O/S (left panel of last row) ratios, and also [α/Fe] (right panel of last row) with metallicity. The blue and orange circles represent, respectively, abundances for stars having effective temperatures above and below 5300, 5300, and 5350 K for C, O, and S abundances, respectively. The gray and light yellow dots represent the same distributions for the stars in the Hypatia catalog (H14) and in the AMBRE Project (P21), respectively. In the lower left of each panel, we show the median uncertainties in gray. The red and black circles represent, respectively, stars on the high-[α/Fe] and low-[α/Fe] sequences.
Other Images in This Article
Show More
Copyright and Terms & Conditions
© 2026. The Author(s). Published by the American Astronomical Society.

