

Image Details
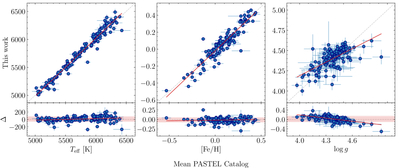
Caption: Figure 16.
Comparisons between the atmospheric parameters determined in this work and from the Mean PASTEL catalog (C. Soubiran et al. 2022). Teff in the left column, [Fe/H] in the middle column, and ﹩\mathrm{log}\,g﹩ in the right column. The lower panels of each row show the residuals, where Δpar = parthis work − parliterature. The gray dashed lines represent equality, 1:1; the red lines are the linear regressions fitted to the data, and the painted area is the ±2 MAD region around the median difference.
Other Images in This Article
Show More
Copyright and Terms & Conditions
© 2026. The Author(s). Published by the American Astronomical Society.

Copyright ©
2026 Astronomy Image Explorer. All Rights Reserved.
