

Image Details
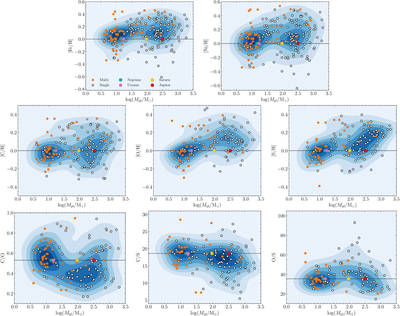
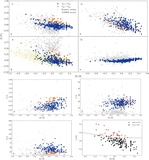
Caption: Figure 12.
Distribution of [X/H] and abundance ratios of host stars as a function of exoplanet mass. In the first row, we show [Fe/H] (left panel) and [Ni/H] (right panel). In the second row, [C/H] (left panel), [O/H] (middle panel), and [S/H] (right panel). In the last row, C/O (left panel), C/S (middle panel), and O/S (left panel) ratios. Stars having only one exoplanet confirmed are presented in white circles (single) and, having more than one exoplanet confirmed, in orange circles (multi). Jupiter, Saturn, Uranus, and Neptune are represented by the red, yellow, pink, and green hexagons, respectively. The blue heat map represents the distribution of all exoplanets, independently of their status as single or multi. The black dashed lines represent the solar values.
Other Images in This Article
Show More
Copyright and Terms & Conditions
© 2026. The Author(s). Published by the American Astronomical Society.

