

Image Details
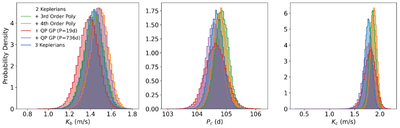
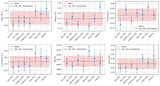
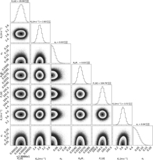
Caption: Figure 4.
Posterior distributions for Kb, Pc, and Kc given different RV model fits. The green histogram shows results when fitting the RVs with two Keplerians plus a third-order polynomial, the orange histogram shows results when fitting the RVs with two Keplerians plus a fourth-order polynomial, the red histogram shows results when fitting the RVs with two Keplerians plus a quasiperiodic GP with a period commensurate with the stellar rotation period, the purple histogram shows results when fitting the RVs with two Keplerians plus a quasiperiodic GP with a period commensurate with the presumed stellar magnetic cycle length, and the blue histogram shows results when fitting the RVs with three Keplerians. All of these fits were done fixing Tb and Pb in accordance with the observed transits. All of the results are consistent within 1σ, except for the best-fit value of Kc as determined by the fourth-order polynomial model and by the three Keplerian model, which are consistent to 1.16σ.
Other Images in This Article
Show More
Copyright and Terms & Conditions
© 2026. The Author(s). Published by the American Astronomical Society.

