

Image Details
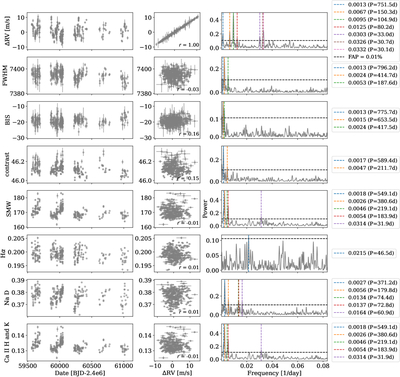
Caption: Figure 1.
HARPS-N DRS 3.3.12 data products. The left column shows the time series of the RVs, followed by the various activity indicators. The middle column shows those values plotted with respect to the RV. The Pearson r correlation coefficient is noted in the lower right of each subpanel. The right column shows the periodograms of these measurements. All of the significant periodicities (FAP < 0.0001) are marked with vertical lines in all of the panels. We have excluded four contrast outliers, four SMW outliers, and four Ca II H and K outliers using 3σ clipping.
Other Images in This Article
Show More
Copyright and Terms & Conditions
© 2026. The Author(s). Published by the American Astronomical Society.

Copyright ©
2026 Astronomy Image Explorer. All Rights Reserved.
