

Image Details
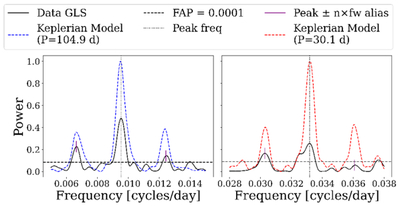
Caption: Figure 2.
This figure demonstrates that three of the periodicities seen in the periodogram of the RVs (at periods of 150.3, 80.2, and 30.7 days) are aliases of the 104.9 and 30.1 day periodicities present in the RV dataset. Both panels show the periodogram of the RV dataset in black. The dotted vertical line marks the peak frequency for each periodogram. The periodograms plotted in the colored dashed lines correspond to a Keplerian with that peak period (P = 104.9 days in blue and P = 30.1 days in red), sampled at the times of the data. The short vertical lines show the calculated aliases of the main peak in the periodogram of the data and the main peak of the window function, which is at 345.47 days. The horizontal dashed line marks an FAP of 0.0001.
Other Images in This Article
Show More
Copyright and Terms & Conditions
© 2026. The Author(s). Published by the American Astronomical Society.

