

Image Details
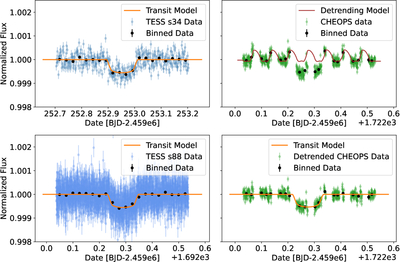
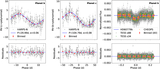
Caption: Figure 5.
Transit light curves and fits for HD 60779 b. The transit models were all fit simultaneously with the RVs; the details are listed in Table 3. The upper left panel shows the flattened 120 s cadence data from TESS Sector 34. This is the original transit detection. The lower left panel shows the flattened 20 s cadence data from TESS Sector 88. The upper right panel shows the CHEOPS light curve, with the detrending model plotted. The lower right panel shows the detrended CHEOPS transit light curve, fit with the transit model. In all panels, the black points show the data in bins of 0.025 d.
Other Images in This Article
Show More
Copyright and Terms & Conditions
© 2026. The Author(s). Published by the American Astronomical Society.

Copyright ©
2026 Astronomy Image Explorer. All Rights Reserved.
