

Image Details
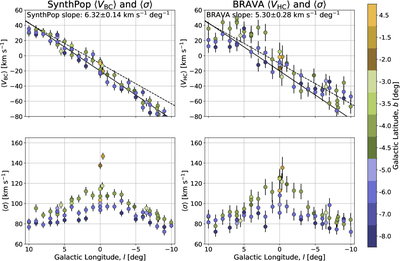
Caption: Figure 11.
The mean RVs (top row) and mean velocity dispersions (bottom row) of simulated SP-H25 catalogs compared to the observed values from the Bulge Radial Velocity Assay (BRAVA) survey. Each color represents a different galactic latitude, b. In the mean RV panels, the solid black lines represent the best-fit line of the SYNTHPOP data, while the dashed black lines represent the best-fit line of the BRAVA data. The slope of each is given at the top of the respective panels.
Other Images in This Article
Show More
Copyright and Terms & Conditions
© 2026. The Author(s). Published by the American Astronomical Society.

Copyright ©
2026 Astronomy Image Explorer. All Rights Reserved.
