

Image Details
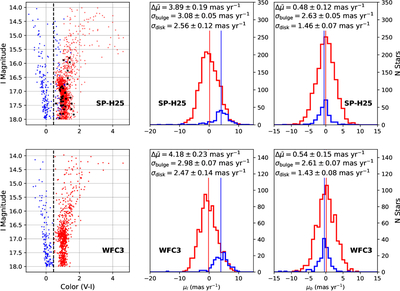
Caption: Figure 8.
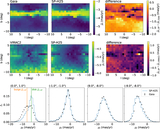
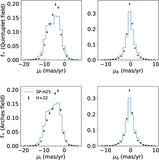
The left two panels show CMDs used to distinguish red (bulge) and blue (disk) stars in the Stanek Window by color. In the top panel, we show SynthPop data and color code the model’s bulge (red points), near-disk (blue points), and far-disk (black points) populations. In the WFC3 CMD, color coding simply denotes the position relative to a (V − I) = 0.45 color cut to separate the populations, which is marked by a black dashed line. The right four panels show proper-motion histograms for the selected red bulge stars and blue disk stars in Galactic longitude μl (middle column) and latitude μb (far column), respectively, for the SP-H25 model (top panels) and WFC3 data (bottom panels). Vertical lines show the mean of each distribution, and the mean differences and dispersions are shown in the top of each panel.
Other Images in This Article
Show More
Copyright and Terms & Conditions
© 2026. The Author(s). Published by the American Astronomical Society.

