

Image Details
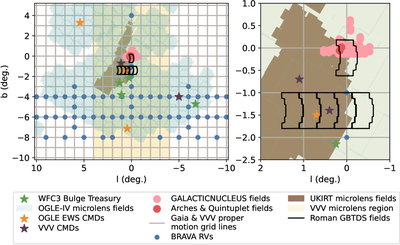
Caption: Figure 1.
Locations on-sky of the observational datasets used to evaluate the SP-H25 model across the full region covered by our extinction map (left) and zoomed in on the Roman GBTDS fields (right). Stars mark scattered bulge fields used for luminosity function (LF) of color–magnitude diagram (CMD) comparisons, while circles mark those focused on the Galactic Center region. The 1° grid lines mark the proper-motion sampling for wide-area surveys, and triangles mark the radial velocity (RV) sample fields. Past microlensing survey fields are shaded in, and the Roman GBTDS fields are outlined in black.
Other Images in This Article
Show More
Copyright and Terms & Conditions
© 2026. The Author(s). Published by the American Astronomical Society.

Copyright ©
2026 Astronomy Image Explorer. All Rights Reserved.
