

Image Details
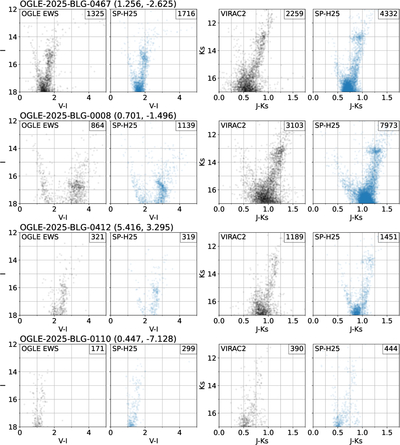
Caption: Figure 5.
Comparison of CMDs for four sample OGLE event alert fields within the region of sky covered by our extinction map with observational data in black and SP-H25 simulations in blue. The left side shows I and V magnitudes with observational data from the OGLE EWS. The right side shows J and Ks magnitudes with observational data from the VIRAC2 catalog.
Other Images in This Article
Show More
Copyright and Terms & Conditions
© 2026. The Author(s). Published by the American Astronomical Society.

Copyright ©
2026 Astronomy Image Explorer. All Rights Reserved.
