

Image Details
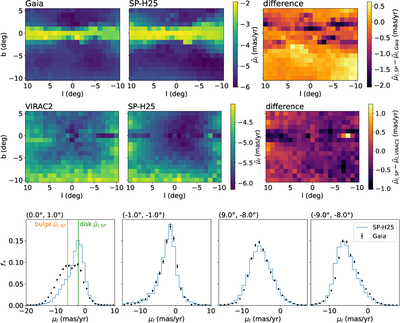
Caption: Figure 9.
Proper-motion component μl comparison between observational catalogs and SP-H25. The top row shows the median values for Gaia DR3 in a grid across the sky, as well as their difference. The middle row shows the same for VIRAC2. The bottom row shows Gaia μl histograms for four individual sight lines that cover different ends of the spectrum for the systematic trends in the top panel.
Other Images in This Article
Show More
Copyright and Terms & Conditions
© 2026. The Author(s). Published by the American Astronomical Society.

Copyright ©
2026 Astronomy Image Explorer. All Rights Reserved.
